The REAL Power in Using PowerGraphics #
John Crawford, Stress Analyst, Honeywell
source: http://www.drd.com/searchable/papers/pg_article/pg_paper.htm
Every so often, people tell me that they don’t like using PowerGraphics because it frequently yields different stress results from those they obtain using Full Graphics. Since Full Graphics has been around since the early days of ANSYS they assume that it must be correct and that PowerGraphics must somehow be flawed. To add insult to injury, when there is a difference, the PowerGraphics stresses are higher than the Full Graphics stresses. Given two possible answers, the answer which is closer to the desired answer (usually the lowest stress) is the one which most people embrace. Hence, the general consensus is that Full Graphics is in and PowerGraphics is out.
Of course, for every problem there is only one correct answer, and Mother Nature always knows what it is. Our challenge comes in using the analytical tools at our disposal to provide an accurate simulation of what nature already knows. If the answers displayed by PowerGraphics and Full Graphics are different, which one is closer to the truth? This is an important question, so I decided to look into this problem and see what I could learn.
PowerGraphics was introduced in ANSYS 5.1, and became the default graphics display mode in 5.4. It uses a different display algorithm than Full Graphics, and was designed to be a much faster way of processing graphical data. According to Paul Tallon, Senior Development Engineer at ANSYS Inc., "PowerGraphics was originally developed to support the P-elements introduced in ANSYS 5.1. We needed to increase graphical display speed because P-element results are plotted using a quadratic function. We were able to speed up plotting by storing in a graphics object the data only for those elements which have exterior faces. We then developed a high performance graphics engine to process this data. Because this is a much faster way of processing graphical data, we extended it to H-elements and eventually to solid model entities as well."
So, the difference between traditional Full Graphics and PowerGraphics is that Full Graphics processes data for all of the currently selected elements, while PowerGraphics only processes data for the selected elements which have a face on the exterior of the model. This isn’t a problem for hexahedral meshes because nearly all the elements that touch the exterior do so with an entire face. Therefore, the PowerGraphics answers and Full Graphics answers are almost always identical for hexahedral meshes. But tetrahedral meshes are a different story because they always contain elements which only have one node exposed on the exterior of the model. Since these elements are not included when the averaged nodal stresses are calculated, the PowerGraphics result may be significantly different than the Full Graphics result.
Since the highest stress in a model is usually on the exterior, it seems that PowerGraphics would be the more accurate way of viewing result data. But is this really true? To find out, I made an example problem which would help me determine whether PowerGraphics or Full Graphics is the way to go.

The example problem was a cylinder, fixed at one end, with a semi-circular notch cut out of the top where another cylinder intersected it. A positive pressure load was applied to the notched area, and a negative pressure load applied to the free end of the cylinder. Pressure loads were used to avoid any singularities which might result from using point loads. The volume was meshed with SOLID92 elements using SmartSizing to vary the mesh from coarse to fine. The results were then viewed using PowerGraphics and Full Graphics to plot the averaged Von Mises stress (PLNS,S,EQV). Just for comparison purposes, I also plotted the unaveraged Von Mises stresses (PLES,S,EQV), which yields the same results regardless of whether PowerGraphics or Full Graphics is being used. These results are listed in Table 1.

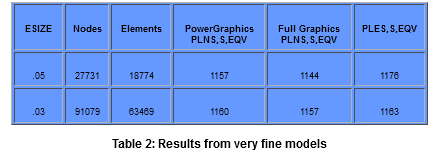
follow the trend exhibited by the previous models, and can be found in Table 2. It is reasonable to assume that the answer obtained from the finest model is a reasonable approximation of what the real answer is, and these results were used to normalize the results obtained from the SmartSized models.
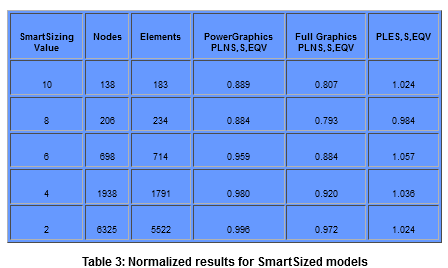
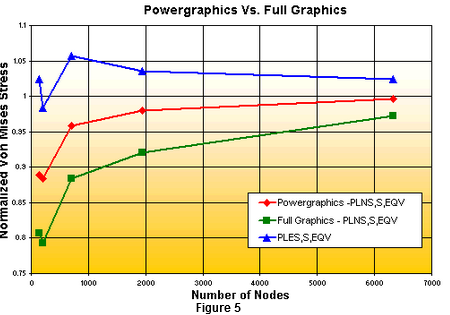
As you might expect, the normalized results listed in Table 3 and plotted in Figure 5 show that the stresses plotted using PowerGraphics, Full Graphics, and unaverage nodal stress all converge towards a common answer as element density increases. What you may not have expected is that the PowerGraphics results are always closer to the real answer than either the Full Graphics or the unaveraged nodal stress results, except for the case of an extremely coarse mesh where the answers are questionable anyway.
The normalized results also show that of the three display methods used, Full Graphics is the least accurate, least conservative way of presenting results. The PowerGraphics results are closest to the real answer, but are not as conservative as the unaveraged nodal stresses. Conservatism is a fundamental engineering concept, and it is up to the analyst to determine whether PowerGraphics or the unaveraged nodal stresses are most appropriate way to display results for the problem under investigation. But no matter how you look at it, the Full Graphics results are less accurate, less conservative, and should be avoided when postprocessing results for tetrahedral meshes.
The important thing to learn from this brief study is that there is only one correct answer for a given problem, and a substantial difference between PowerGraphics and Full Graphics should be a warning flag that your results are questionable. Depending on the degree of accuracy and conservatism called for by your problem, you might report the PowerGraphics results, the unaveraged nodal stress results, or remesh your model and try again. While PowerGraphics was developed as a faster plotting algorithm, the real power in PowerGraphics is that it’s a more accurate way of presenting results than Full Graphics is.
The Effects of /GRAPH and /EFACET on Displayed Results
Occasionally, there are discrepancies among displacement contour plots, depending on /GRAPH and /EFACET settings. For one representative model, the following discrepancies could be observed from a modal analysis of a SOLID95 mesh:
Max USUM contour values:
Full graphics : .1266
Power graph w/ /EFACET,1: .1235
Power graph w/ /EFACET,2: .1270
Power graph w/ /EFACET,4: .1272
It is possible that /GRAPH and /EFACET settings can affect contour plots of displacement values. Here is the explanation:
1. Full graphics:
Even though Full graphics plots only the corner nodes of elements, it uses the full set of nodal results at all nodes (including midside nodes) when calculating the contour range. For this model, the maximum nodal displacement occurred at a midside node, and this maximum value therefore affects the DMX and maximum contour value reported in the plot.
2a. Power graphics, /EFACET,1
Power graphics uses only the values for the specified subgrid level when reporting DMX and when calculating the contour range. For /EFACET,1, only results at the corner nodes are included. For this model, then, the maximum contour value is based on corner-node values only. The maximum value at a midside node is not considered, leading to a discrepancy between this plot and the Full graphics plot.
2b. Power graphics, /EFACET,2:
For /EFACET,2, subgrid points include the midside nodes, and the centroid of each element face. For this model, the displacement was greatest at the centroid of one face, causing a further discrepancy.
2c. Power graphics, /EFACET,4:
For /EFACET,4, subgrid points include the midside nodes, quarter points along each edge, the centroid of each element face, and the quarter points of each element face. For this model, the displacement was greatest at a quarter point on a face, causing a further discrepancy.
If you zoom in on the element having maximum displacements, turn on /PNUM,SVAL,1, and plot contour values with these various settings of /GRAPH and /EFACET, you should readily observe these effects.
For this model, the most accurate displacement value will be obtained with /GRAPH,POWER and /EFACET,4. If a significant discrepancy is found between /GRAPH,FULL and PowerGraphics with /EFACET,2 or 4, then this would give a quick indication that the mesh might be too coarse. For this model, the discrepancy appears to be relatively small, indicating that the mesh was probably fine enough.